Breaking News
 Meet The Heroes That Gave Their Own Lives To Save Others During The Texas Flood
 Scientists Reverse Parkinson's Symptoms in Mice: 'We were astonished by the success'
 America Is A Great Nation And A Work-In-Progress | Something To Stand For #60 | The Way I Heard It
 Centuries of hidden evidence: Vaccines' neurological toll revealed
Top Tech News
 xAI Grok 3.5 Renamed Grok 4 and Has Specialized Coding Model
 AI goes full HAL: Blackmail, espionage, and murder to avoid shutdown
 BREAKING UPDATE Neuralink and Optimus
 1900 Scientists Say 'Climate Change Not Caused By CO2' – The Real Environment Movement...
 New molecule could create stamp-sized drives with 100x more storage
 DARPA fast tracks flight tests for new military drones
 ChatGPT May Be Eroding Critical Thinking Skills, According to a New MIT Study
 How China Won the Thorium Nuclear Energy Race
 Sunlight-Powered Catalyst Supercharges Green Hydrogen Production by 800%
Flaws in 150 Years of Global Temperature Data Blow Holes in Global Warming Narrative

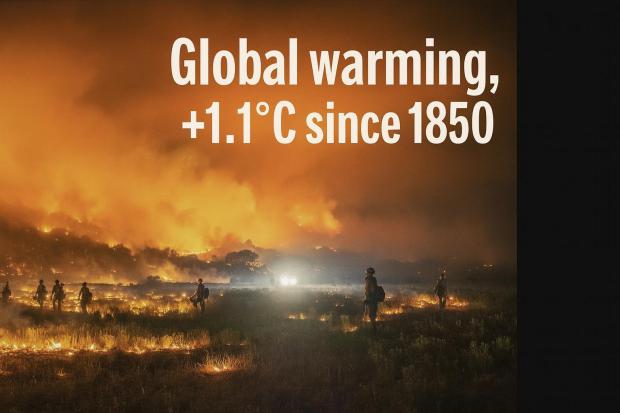
The National Oceanic and Atmospheric Administration (NOAA), however, begins its "reliable" records in 1880 and reports an increase of about 1.1°C (2.0°F) since then. Even NOAA acknowledges the limitations of early data, stating, "Earth's surface temperature has risen about 2 degrees Fahrenheit since the start of the NOAA record in 1850."
But these claims rest on flawed foundations. Ninety-six percent of U.S. temperature stations fail to meet NOAA's own siting standards and are often surrounded by development, resulting in inflated readings from the urban heat island effect. The transition from mercury thermometers to digital sensors between the 1980s and 2000s introduced discontinuities in the data, right during the period of supposed accelerated warming. Early measurements were geographically concentrated in Europe and North America, ignoring vast regions, especially the 71% of the planet covered by oceans.
Measurement errors of ±0.5°C often exceed the very climate signals being used to justify sweeping policy changes. Worse still, much of the raw data has been adjusted or "homogenized" using subjective assumptions that can introduce as much bias as the trends being studied. These problems, taken together, undermine the precision required to detect the small temperature changes that underpin today's aggressive climate agenda.
Approximately 96 percent of temperature stations used to measure climate change fail to meet the National Oceanic and Atmospheric Administration's own standards for "acceptable" and uncorrupted placement. This finding comes from Anthony Watts' Surface Stations Project, documented in multiple studies including "Corrupted Climate Stations: The Official U.S. Surface Temperature Record Remains Fatally Flawed."
Watts and his team of volunteers found stations "located next to the exhaust fans of air conditioning units, surrounded by asphalt parking lots and roads, on blistering-hot rooftops, and near sidewalks and buildings that absorb and radiate heat." Even more troubling, data from properly sited stations show "a rate of warming in the United States reduced by almost half compared to all stations." This suggests that a significant portion of reported warming may be artificial, created by poor measurement practices rather than actual climate change.
One of the most persistent flaws in the temperature record is the urban heat island effect. Many weather stations originally placed in rural areas during the 1800s and early 1900s are now surrounded by urban development. Cities generate heat through concrete absorption, reduced vegetation, and dense human activity, producing temperature readings that are consistently 2–5°F warmer than nearby rural areas. This is not speculation, it's basic physics.

 He 3D Printed a Whole House

